Goals and Objectives:
The goal of this lab was to geocode the locations of our sand mines in Wisconsin. Each Student had to geocode 21 different mines, because of overlap each mine was geocoded by at least 3 different people. The next goal was to compare positional accuracy of our mines to our classmates mines and the actual location of the mines provided by our professor.
Methods:
We were provided with a table (from the WI DNR) containing a lot of information about all of the frac sand mines in Wisconsin, including but not limited to owners, addresses, counties, zip code, etc. as seen below in Figure A. I had to find the mines I was responsible for and create a normalized table from the information given. The normalized table, created in Excel can be seen below, Figure B. The normalized table was important because it separated the addresses, zip codes, City, State and in some cases PLSS information. From there I added the table into ArcMap; using the Geocoding Addresses dialog box I created a shape file out of it. In order to do so I used my UWEC information to log into an Enterprise Account and geocode the addresses using the World Geocode Service. 16 of the addresses from the table had matches in the geocoding process, the other 5 were unable to be processed from the given information, this required further inspection and finding the addresses myself.
The of the 5 addresses that were incorrect, were incorrect because the addresses was unidentifiable or because the information given was in PLSS (Public Land Survey System) format. Using a basemap in ArcMap, the address inspector function, and Google Maps I was able to find the location of these mines and select their point for my shape file. When I was selecting the locations, I made sure to select what I believed to be the correct address based on the information I was given, and I also made my point as close to the road system to ensure best accuracy.
 |
| Figure A: Table provided by the WI DNR containing a plethora of not normalized information about each mine. |
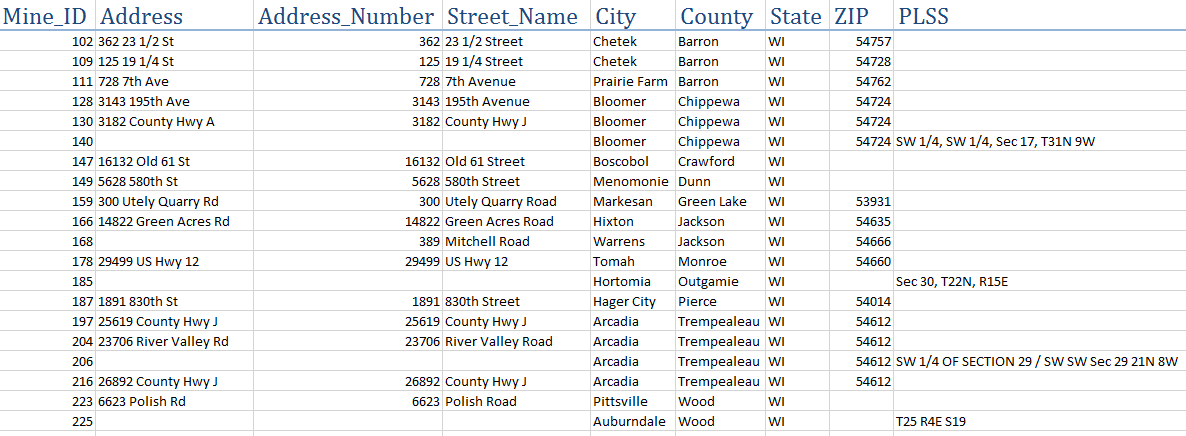 |
| Figure B: My normalized Excel table of the mines I was responsible for. |
Once all geocoding was complete I added my shape file and the shape files of my 3 classmates who geocoded mines with the same Mine Unique ID as mine. Between those three all of mine were accounted for and I was able to compare the positional accuracy for all of my mines. To do this I had to first project all of our shape files into a different coordinate system because I needed my distances in meters, not in decimal degrees. Using the project tool, I changed them all to WGS_1984_World_Mercator projected coordinate system. Then I used the Near Tool to calculate the distances between my mines and my 3 classmates mines; these can be seen below in Figures D, E, and F. After that was completed I did the exact same thing with the actual mine locations provided by my professor in a shape file, these results can be seen in below in Figure G.
Results:
 |
| Figure C: Shows the location of my geogoded mines (red) compared to the actual mine location (blue). |
 |
| Figure D: Shows the distances between some of my mines and one of my classmates mines. Larger numbers (meters) indicate higher discrepancies between my geocoding and theirs. The average distance between our points is 7,342 meters. |
 |
| Figure E: Shows the distances between some of my mines and one of my classmates mines. Larger numbers (meters) indicate higher discrepancies between my geocoding and theirs. The average distance between our points is 434 meters. |
 |
| Figure F: Shows the distances between some of my mines and one of my classmates mines. Larger numbers (meters) indicate higher discrepancies between my geocoding and theirs. The average distance between our points is 4,216 meters. |
 |
| Figure G: Shows the distances between my mines and the actual mine locations. Larger numbers (meters) indicate higher discrepancies between in my geocoding. The average distance between my points and the actual points is 5,166 meters. |
Discussion:
The accuracy between my results and the results of my three peers was on average, 3,997 meters apart. The average distance between my mines and the actual mine locations, as seen above in Figure G, was 5,166 meters. Errors in accuracy could have been caused by many different factors and mistakes made by myself and my classmates. A possible error may have occurred in the field, the survey crew who recorded the location of the mine may have placed the point in the center of the mine and my point was placed at the road, or nearest to the exit. Another mistake could have been made when geocoding. The geocoding tool uses and actual address, and that address point on the map may not accurately reflect the location of the mine. Lastly, when geocoding for mines when I did not have a specific address I used the the basemap, Google Maps, and the PLSS information. When using these aerial views I may have selected a mine that was incorrect or possibly not even selected a mine at all because the aerial maps could have been outdated.
Conclusion:
This lab was very good at portraying how difficult and easy geocoding can be simultaneously. ArcMap has great tools to help geocoding go smoothly, but unless all the requirements are met correctly, it can be a real pain. It was also a learning experience having to deal with other people's data, because there can be many difficulties that come with it. Normalization is now a concept I understand much better, and have a firmer grasp on. All in all it was a good learning experience normalizing data, geocoding, and finding accuracy with my datasets and my peers.
No comments:
Post a Comment