Goals and Objectives:
The goal of this lab was to use various raster geoprocessing tools to build models for both sand mining suitability and environmental and cultural risk in Trempealeau County, WI. Using different tools such as, Reclassify, Euclidian Distance, project, polygon to raster, slope, block statistics, and raster calculator, and using different raster layers such as, DEM (digital elevation model), land use and land cover datasets, and geology I was able to look at the suitability of the land as well as the impact a mine would have. I created two different data flow models, one for land suitability, and the other for risk assessment, using raster calculator I was able to put these two together to create a location index. The index being a collaboration between my two final criteria shows where sand mines should be created to minimize impact and maximize suitability.
Methods:
SUSTAINABILITY MODEL
I was given 5 variables that are considered important when finding suitability:
The data I had available through previous labs and downloading (water table depths) was not all in raster format. After transforming my data into raster, I needed to rank my data based on how important it would be to sustainability and risk. The ranking was of 1-3, 1 having low suitability/high risk and 3 having high suitability/high risk (a rank of 2 was somewhere in between). In two instances (geology and land use) the rank of 0 was given, this is because the geology was not silica sand bearing geology and the land use was water (Figure A below).
 |
| Figure A shows the rankings and values in each category that correspond with the ranking system. |
You can see below in Figure B, that each variable was modified using a series of tools to analyze the data and create rasters. The rasters were then all combined using raster calculator to create the final Suitability map.
 |
| Figure B is my data flow model to determine the suitability of an area for Frac Sand Mining. |
Geology: The Jordan and Wonewaoc formations were selected for sand mining, these were given a ranking of 3, while all other geologic formations received a 0. Figure C is the result. Land Use: Based on what was most practical, it would not be practical or possible to put a sand mine on a lake or on water or in a developed area, these were removed by classifying them as NoData. Figure D is the result. Railroads: The railroads were ranked on how far away the mine was from the rail terminal. The further the distance the lower the ranking for suitability, because trucking sand long distances costs money and can damage the roads. See Figure E. Slope: Slope ranking was based on how steep the slow is for an area. Steeper slopes are given a lower ranking because it would be more difficult and time consuming to build a sand mine on a steep slope. See Figure F. Water Table: Ranking based on how deep the water is in the ground. If the water table was closer to the surface, it was given a higher ranking because of accessibility. See Figure G.
 |
| Figure C. |
 |
| Figure D. |
 |
| Figure E. |
 |
| Figure F. |
 |
| Figure G. |
I was given 4 variables to use to determine how a mine would impact an area. The 5th variable I got go choose.
- Streams
- Prime Farmland
- Residential proximity
- Schools
- Bike Trails
 |
| Figure H is my data flow model to determine the impact on the area of a Frac Sand Mine. |
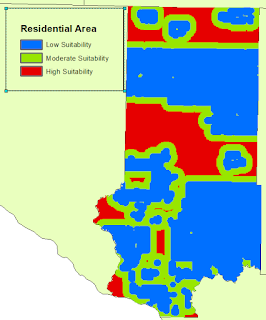
Streams: streams located near sand mines could potentially be negatively impacted by runoff and cause a loss of wildlife. A higher ranking is awarded the further away from the stream an area is. Only certain streams were selected, those with an order greater than 2, this means they flow more and year round. Seen below in Figure I. Prime Farmland: it is better to find mining sites that are not on prime farmland; therefore, areas of poor farmland were given a higher ranking than areas with prime farmland, seen in Figure J. Residential areas: land further away from residential areas was given a higher ranking than land closer to residential areas. This is because mines produce dust and noise, both of which are not favoured near peoples' homes, Figure K. Schools: having a mine near a school could result in both class disruption from noise and children's health due to dust particles. Land further from a school received a higher ranking than land closer to a school, seen below in Figure L. Bike trails: land further from bike trails received a higher ranking than land closer to bike trails. This is because biking takes a lot of energy and breath, if someone is biking it could be dangerous to their health to have a sand mine too close to the trail. Also people go on bike trails for the beautiful scenery, a sand mine might destroy that. Results shown in Figure M below.
 |
| Figure I. |
 |
| Figure J. |
 |
| Figure K. |
 |
| Figure L. |
 |
| Figure M. |
Results:
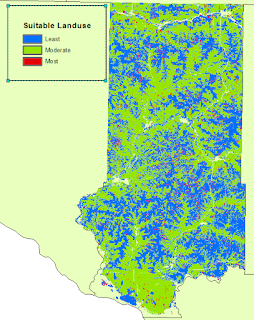
The results of the mining suitability data flow model can be seen below in Figure N. Areas with a higher number are areas that are more suitable for sand mining. The results for the Impact data flow model can be seen in Figure O. A higher number on this map corresponds with a lower impact. On BOTH maps a higher number shows a better area to put a mine.
 |
| Figure N. The southern part of the county is more suitable for sand mining |
 |
| Figure O. High impact/risk areas are spread evenly throughout the state. |
Below Figure P is the combined output of both maps. It uses criteria from both maps to create a map that shows the prime areas to put sand mines, and the worst areas to sand mines.
 |
| Figure P. |
From Figure P it is easy to tell which areas are more suitable and would have the least amount of risk/impact associated with putting a sand mine in an area. The final map could use some improvements before it would be used in a real situation. If the map was going to be used by professionals it would need more detail of the qualities of land in the farmland and land use departments, because that data is from 2011 which is nearly 5 years ago now. An update in data would potentially change the outcome of the ranking system to better show real life conditions. In my model all of the variables carry the same weight, this would not be the case in the real world, certain things may be more important, like streams for example, this would change the outcome of the map. This is shown by the Python Script I had to do for the other part of the lab.
Conclusions:
I learned a lot about the spatial analysis tools and rasters while doing this lab, in particular the reclassify and Euclidian distance tools. This lab and the previous lab really focused on the evaluation of sand mining and have been very useful for me in learning and mastering GIS. These skills, maps, and practices can be very helpful for the mining industry and local governments as they construct mines and regulate policies.
Sources:
Wisconsin Geological and Natural History Survey (GNHS). Water table contours. GIS data. (n.d). Retrieved December 6, 2015, from http://wgnhs.uwex.edu/map-data/gis-data/
Wisconsin Geological and Natural History Survey (WGNHS). B.A. Brown, 1988. Bedrock Geology of Wisconsin, West-Central Sheet, WGNHS Map 104. Digitizing by Beatriz Vidru Linhares, University of Wisconsin Eau Claire (UWEC). Retrieved from UWEC GIS resources.
Bureau of Transportation Statistics. (n.d.). Rail terminals feature class. Retrieved December 6, 2015, from http://www.rita.dot.gov/bts/sites/rita.dot.gov.bts/files/subject_areas/geographic_information_services/index.html
Land Records. (n.d.). Trempealeau County Land Records. Geodatabase. Retrieved December 6, 2015, from http://www.tremplocounty.com/landrecords/
United States Geological Survey, National Map Viewer. National Land Cover Database (NLCD) raster and DEM. (n.d). Retrieved December 6, 2015, from http://nationalmap.gov/viewer.html

No comments:
Post a Comment